How to Make a Line Chart with GeoGebra
You can use GeoGebra to make two kinds of line charts.
The first variety of line chart utilizes discrete observation. We’ll look at how to make this kind of line chart in Item 6.
The second type is a line chart where the observation times are intervals—where the line chart connects the middle points of the bins in a histogram. So, in order to make this kind of line chart in GeoGebra, you have to make a histogram first. I’ll show you how to make this kind of line chart in Item 7.
GeoGebra Instruction 1
Line Chart with Discrete Observation Times
- 1.
- Open
Algebra View,Graphics ViewandSpreadsheetmode under
Viewin
Menu. - 2.
- Enter the observation times converted to hours (e.g.
9.30AM is entered as9.5) in columnA. - 3.
- Enter your observations in column
B. - 4.
- Make a list by selecting all observation times and clicking
List in
in Toolbar. In the pop-up window that appears, changeNameto “Times” and clickOK. - 5.
- Make another list by selecting all observations and clicking
List in Toolbar. In the pop-up window that appears, changeNameto “Observations” and clickOK. - 6.
- In
Algebra View, typeLineGraph(<List of x-coordinates>, <List of y-coordinates>)
and replace
<List of x-coordinates>withTimes, and<List of y-coordinates>withObservations.The line chart is displayed in
Algebra View.

GeoGebra Instruction 2
Line Chart with Continuous Observation Times
- 1.
- Open
Algebra View,Graphics ViewandSpreadsheetmode under Viewin Menu. - 2.
- Enter the lower endpoint of the first interval in column
A. - 3.
- Enter the upper endpoint of each interval (including the first one) in the cells below.
- 4.
- Enter your observations in column
B. Check that you have one more filled-in cell in columnAthan in columnB. - 5.
- Make a list by selecting all observation times and clicking
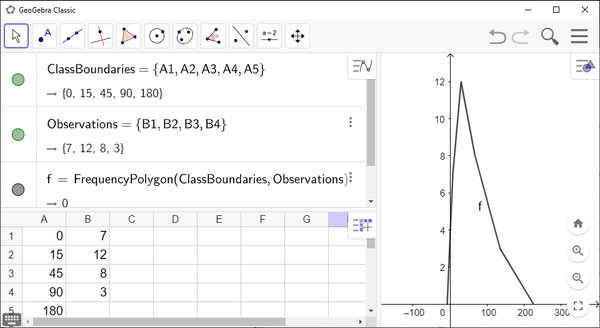
List in Toolbar. In the pop-up window that appears, changeNameto “ClassBoundaries” and clickOK. - 6.
- Make another list by selecting all observations and clicking
List in Toolbar. In the pop-up window that appears, changeNameto “Observations” and clickOK. - 7.
- Use the command
FrequencyPolygon(<List of Class Boundaries>, <List of Heights>)
in
Algebra View. Insert “ClassBoundaries” as<List of Class Boundaries>and insert “Observations” as<List of Heights>. PressEnter.Your line chart will be displayed in
Graphics View. Remember to adjust the window so that the entire chart is visible.